Peer-reviewed evidence behind voice-first fluid balance management.
It’s not just slow. It’s clinically inaccurate. The current paper-to-EHR workflow introduces multiple points of failure.
Only 12% of patients with a clinical indication for fluid monitoring actually had documentation (Alexander & Allen, 2011). 75% of patients actively developing AKI had incomplete fluid records (Joslin et al., 2015). When charts do exist, errors range up to 2,405 mL cumulative, with 5.8% of charts off by more than 2,000 mL (Davies et al., 2014). Across 18 studies, more than half found ≤50% chart completion. Even after interventions, only 5 of 13 studies reached 75%.
Nurses spend 40% of their shift on documentation and 35% interacting with the EHR. Fluid data is often batched at end-of-shift, meaning physicians make decisions on stale data.
Voice-enabled clinical documentation has been shown to reduce charting time by 50% and complete notes 3× faster than keyboard entry. Yet no existing solution applies this to fluid balance specifically.
25–35% of all fluid balance charts contain calculation errors or significant omissions. Cumulative errors reach up to 2,405 mL, enough to completely mask developing kidney injury. Only 28% of charts were complete before dysnatraemia, and 37% had no fluid balance calculation at all (Herrod et al., 2010). The EHR Flowsheets module scores just 62.13 on usability (SUS), with 60% of nurses rating it burdensome.
Nurses work with gloved hands, moving between rooms, managing multiple patients. The keyboard is the bottleneck. BedSync’s voice layer lets nurses log fluid events the moment they happen — tap, speak, confirm.
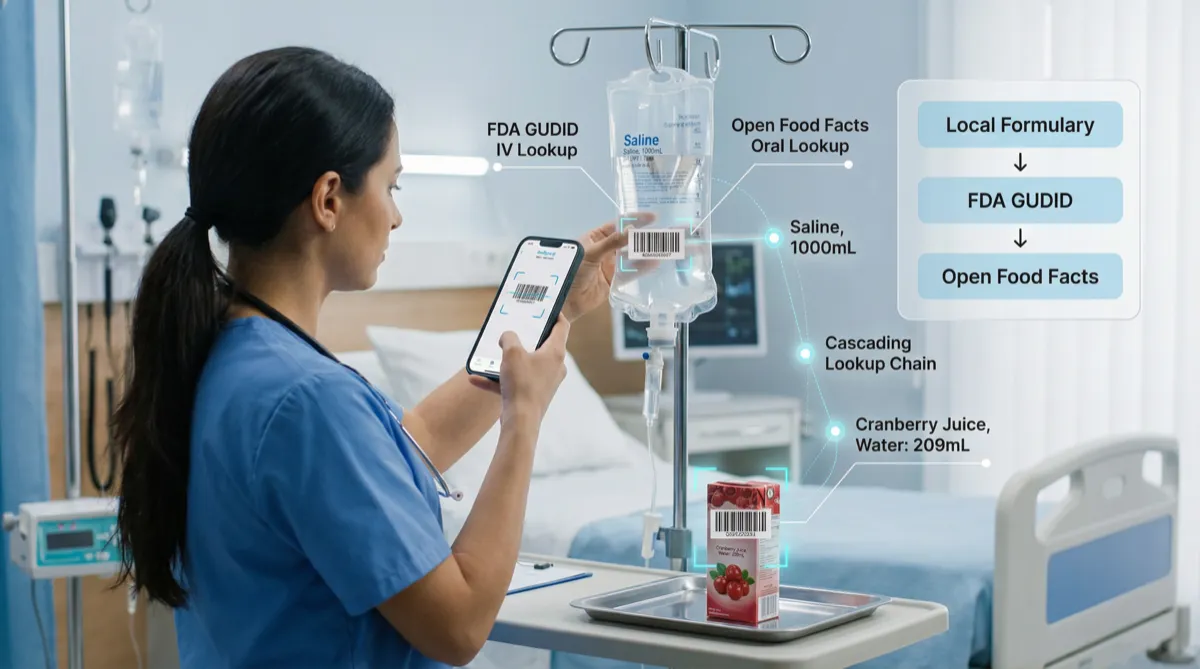
Say it naturally: “240 mL cranberry juice”. BedSync’s NLP engine extracts fluid type, volume, and route, then maps cranberry juice to its water equivalent automatically. Select the patient, tap the mic, speak, confirm. No rigid commands. No memorized syntax.
Voice input doesn’t create a free-text note. It populates discrete, structured fields: volume, fluid type, route (oral/IV/output), and timestamp. Running balance updates instantly. Data is export-ready as FHIR R4 or CSV for your EHR.
Voice, barcode scanning, and manual entry — each optimized for a different workflow. Scan an IV bag for instant product lookup, speak a bedside observation, or tap through quick-log buttons. Every entry is verified on-screen before it commits.
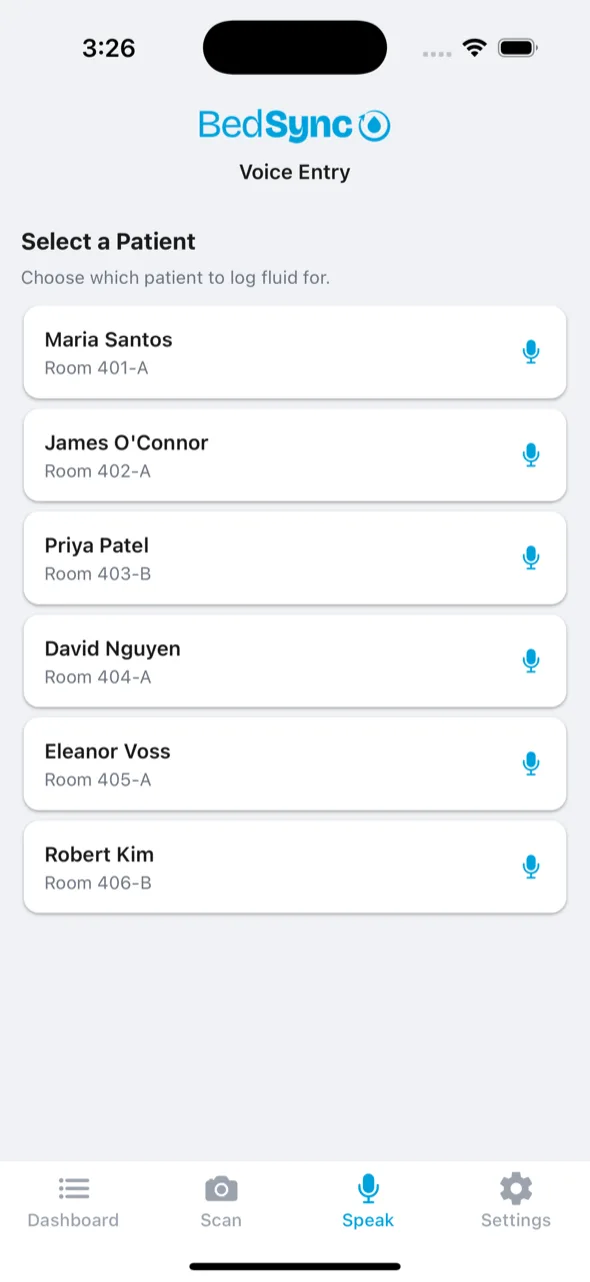
Open from a patient’s chart and voice is pre-assigned. Open from the ward view and BedSync shows a quick patient picker. Tap a name, tap the mic, done. The system auto-detects intake vs. output from natural speech.
No one else is applying voice intelligence to fluid balance. Dragon Copilot, Commure, and Aiva handle general nursing documentation. BedSync is the only platform combining voice capture with fluid-specific NLP, I/O conversion logic, and AKI risk staging.
BedSync doesn’t just capture data. It turns fluid documentation into a real-time clinical intelligence layer. Every feature was designed with nurses, validated against peer-reviewed evidence, and built to run on a standard smartphone.
Scan any IV bag barcode and BedSync queries the FDA Global Unique Device Identification Database in real-time, automatically identifying Normal Saline, Lactated Ringer’s, D5W, and other IV crystalloids with manufacturer, volume, and water content. No manual selection. No memorized product codes.
51% fewer potential adverse drug events with barcode-verified medication administration.
Poon et al., NEJM, 2010Scan a juice box, broth container, or nutritional supplement and BedSync pulls product data from the Open Food Facts database and computes water equivalents from macronutrient composition. A 240 mL cranberry juice is ~209 mL of actual water intake. BedSync calculates this automatically.
Only 27% of visual fluid estimates by nurses fall within a 10% error margin.
McLister et al., PMC, 2022Three-tier identification: Local formulary → FDA GUDID → Open Food Facts. The system tries each source in sequence, with graceful fallback to manual entry. Works offline via local cache, syncs when connected. Every scan result shows its source for full transparency.
Barcode scanning reduces pump programming time by over 80%.
Shah et al., PMC, 2016
BedSync continuously calculates AKI stage from urine output data using the KDIGO 2012 criteria: Stage 1 (<0.5 mL/kg/hr for 6h), Stage 2 (<0.5 for 12h), Stage 3 (<0.3 for 24h or anuria for 12h). Color-coded badges on every patient card give charge nurses instant ward-wide visibility.
Mortality odds increase 4.3× at Stage 1 and up to 60× at Stage 3 vs. no AKI.
Kellum et al., Kidney International, 2019BedSync goes beyond standard KDIGO staging with a proprietary pre-alert system. When urine output drops to 0.5–0.7 mL/kg/hr for 3+ hours (below normal but above Stage 1 criteria), the system flags the patient as “At Risk” with an amber warning. This extends the intervention window by hours.
UO changes signal AKI 2.4–46 hours before creatinine rises.
Willner et al., Critical Care ExplorationsA 12-hour bar chart on every patient detail screen shows hourly urine output with a KDIGO threshold line (personalized to the patient’s weight). Bars are color-coded: blue (normal), yellow (below threshold), gray (no documentation). Stale gaps are immediately visible.
Electronic AKI alerts show a 6% overall reduction in in-hospital mortality; before-and-after studies show up to 19%.
JAMA Network Open, 2024
Toggle between 24-hour, Day Shift (07:00–19:00), and Night Shift (19:00–07:00) views. Intake and output totals recalculate instantly for the selected period. No more mental math converting 24-hour balances to shift handoff values.
One-tap shareable report showing current shift balance with intake/output by subtype, 24-hour running total, KDIGO status, UO rate, fluid restriction progress, and weight. Generated in seconds, replacing the 15–30 minutes nurses spend building handoff notes manually.
Long-press any patient card for a quick-entry sheet: Water Cup (240 mL), Juice Box (240 mL), Ice Chips (120 mL), Urine (200/400 mL), Emesis (100 mL). Log a fluid event in under 2 seconds without leaving the ward overview.
Set an IV rate and BedSync auto-accumulates volume over time with no manual re-entry every hour. Bag progress bars show percentage remaining. Stop an infusion with one tap. Accumulated totals roll into the patient’s intake balance automatically.
Graduated documentation alerts at 2, 4, and 6 hours since the last fluid entry. Yellow → orange → red. Visible on both the dashboard and patient detail. Customizable per-patient for post-surgical or high-acuity patients who need more frequent monitoring.
Set patient-specific alert thresholds for positive/negative balance, minimum UO rate, and documentation staleness. Overrides ward defaults for patients who need tighter monitoring: post-surgical, sepsis, heart failure, or any patient on a restricted protocol.
Progressive color-coded bar tracks intake against restriction orders: blue → yellow (75%) → orange (90%) → red (100%). Warning text escalates as the patient approaches the limit. No more manual calculation of remaining allowance.
Automatic calculation using the Holliday-Segar method, adjusted for fever (+10% per °C above 37), intubation (−150 mL), and open wounds (+200 mL). Displayed alongside measured I/O for a more complete fluid balance picture.
Color-coded horizontal bar showing urine vs. drain vs. emesis vs. stool vs. blood loss as proportional segments. Nurses and physicians see output composition at a glance, not just a single total number.
12-hour cumulative balance chart on every patient. Hourly data points show the trajectory of fluid balance over time, not just snapshots. Trending positive? Trending negative? The visual makes it immediately obvious.
Log patient weight directly from the detail screen. Weight history feeds into KDIGO UO rate calculations (mL/kg/hr) and insensible loss estimates. A trigger auto-updates the patient record on each new entry.
Sort the dashboard by room number, net balance, or documentation staleness. Charge nurses see the most concerning patients first. Balance sorting surfaces patients with the most extreme fluid imbalances; staleness sorting surfaces patients who haven’t been documented recently.
Fluid balance is the earliest signal of patient decline. When that data is estimated, batched, or wrong, clinicians lose the window to intervene.
When you solve the clinical problem, the financial ROI follows. Precise fluid tracking isn’t just a safety measure. It’s a cost containment strategy.
RN turnover is at 18.4%. The average hospital loses $3.9–$5.7M annually to turnover driven by documentation burnout. NSI Staffing Report, 2025
Nurses stay 30–60 min past every shift to finish charting. By eliminating the 35% of shift time spent on EHR documentation, BedSync reclaims time for direct patient care. Moy et al., JAMIA 2024
Clinical speech recognition reduces charting time by half compared to keyboard entry. For a 200-bed hospital where nurses spend 40% of each shift documenting, that’s thousands of reclaimed nursing hours per year, redirected to direct patient care. Nuance Dragon Medical One Data Sheet, 2024
We are selecting partner hospitals for our 2026 pilot program. Lead with patient safety.