The Charting Crisis
Half of fluid balance charts are never completed.
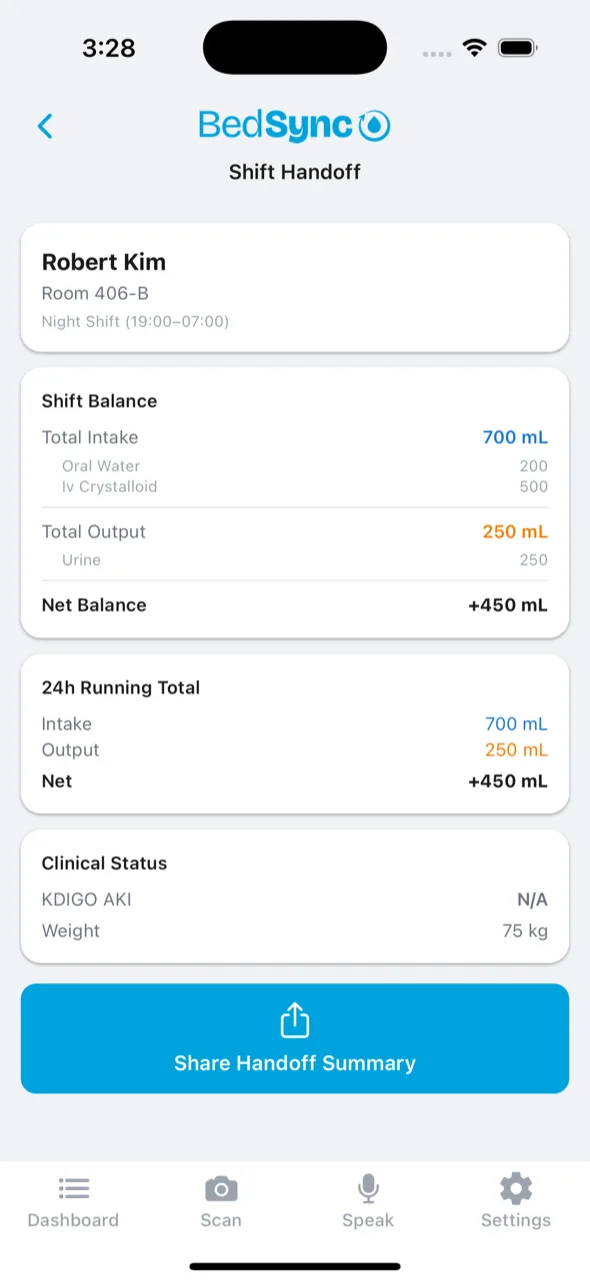
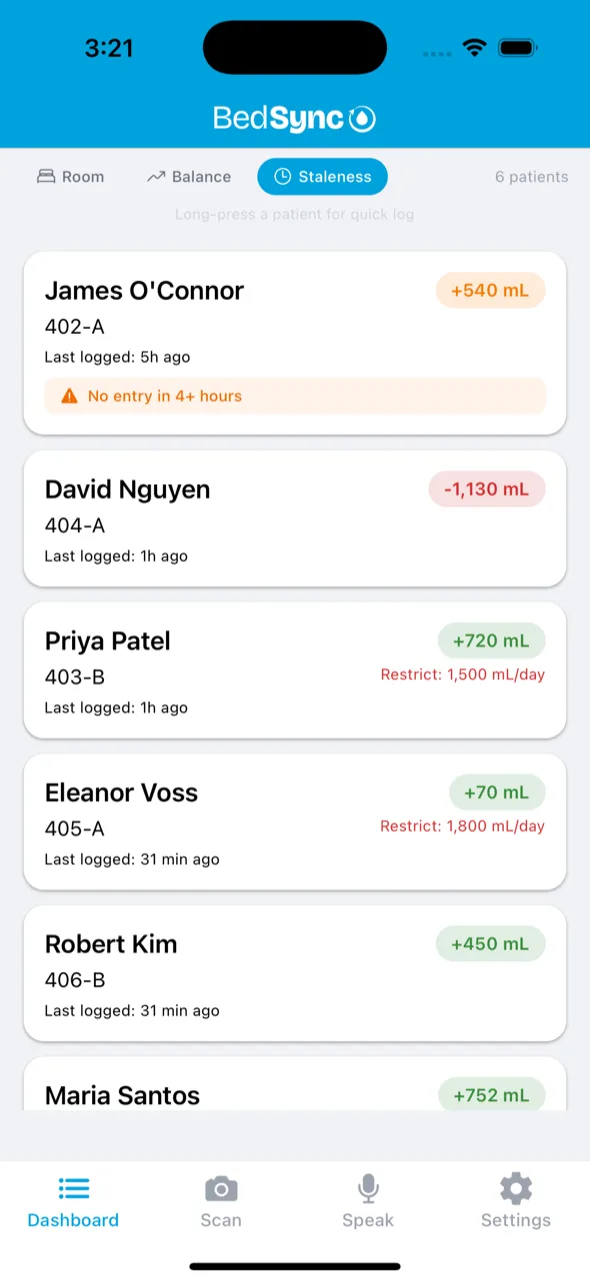
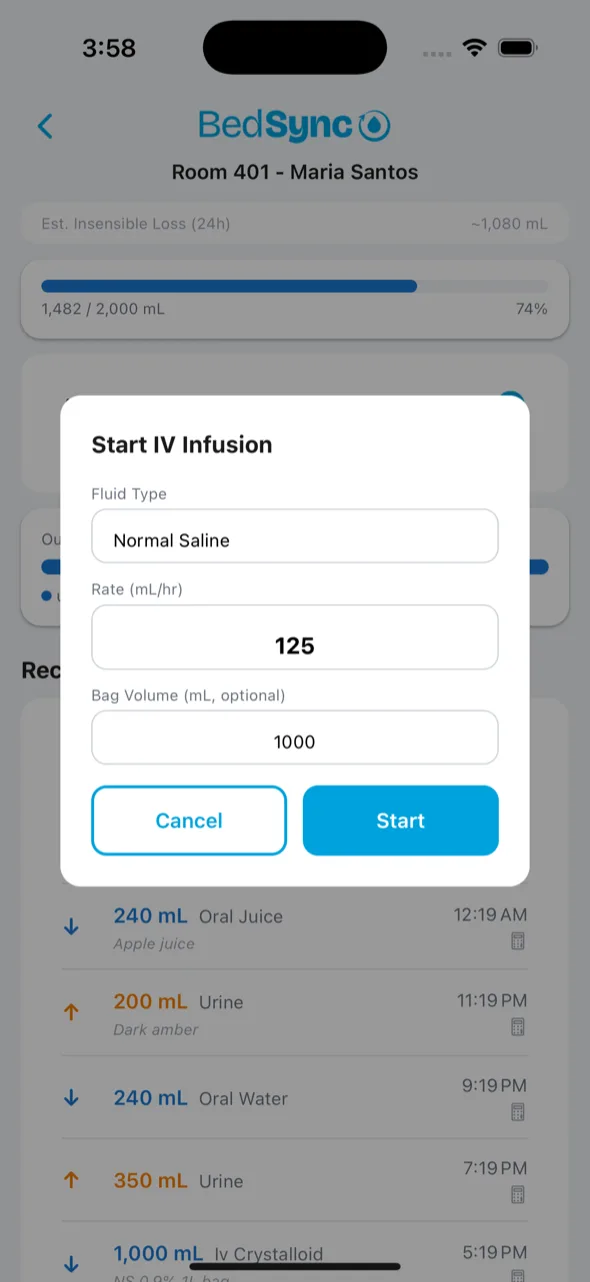
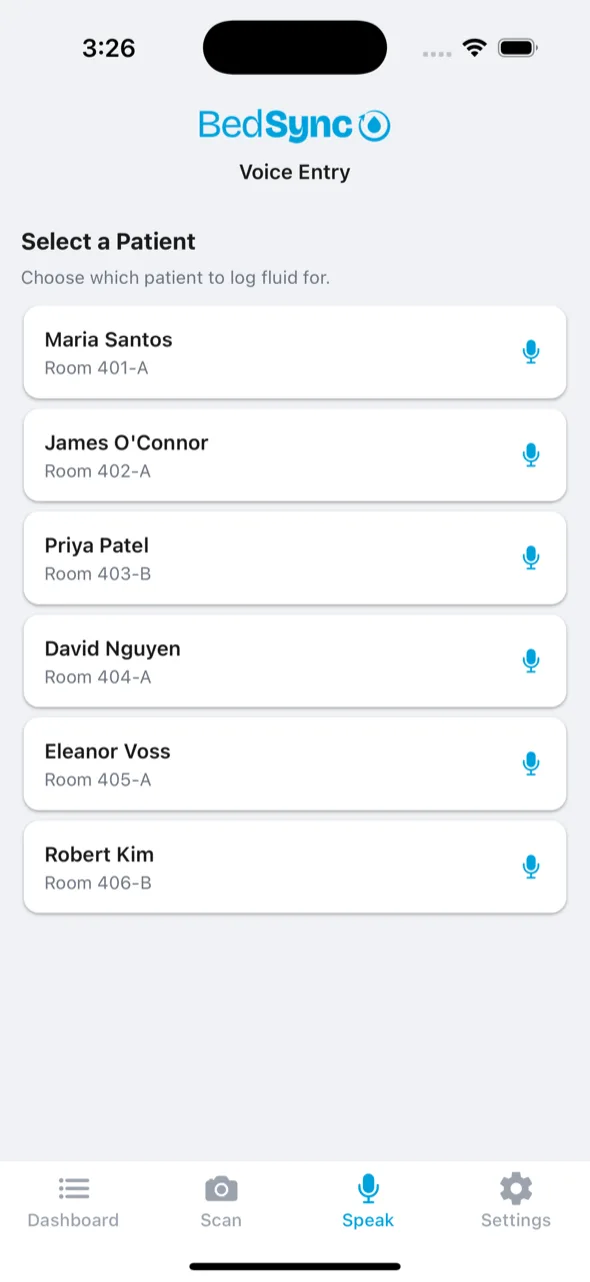
The ones that are? 25–35% contain calculation errors large enough to mask kidney injury, with cumulative errors reaching up to 2,405 mL. Only 12% of patients ordered for I/O monitoring actually had documentation. BedSync replaces manual charting with voice and vision capture. Speak it, scan it, sync it to the EHR.
Validated by 91 Clinicians in field research.
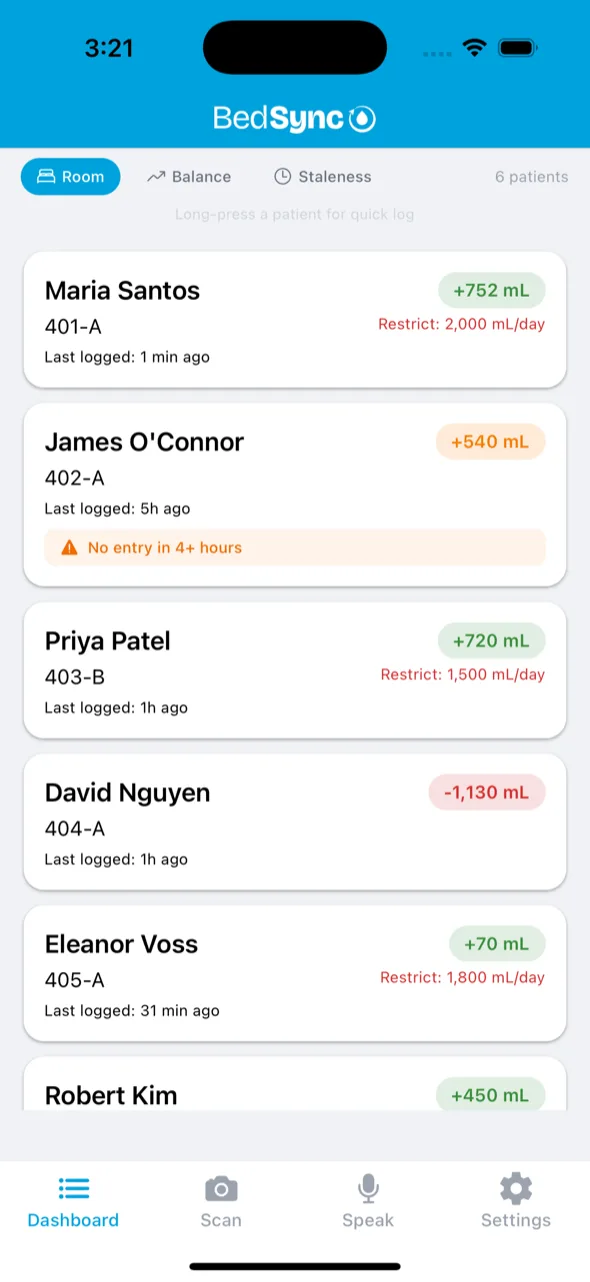
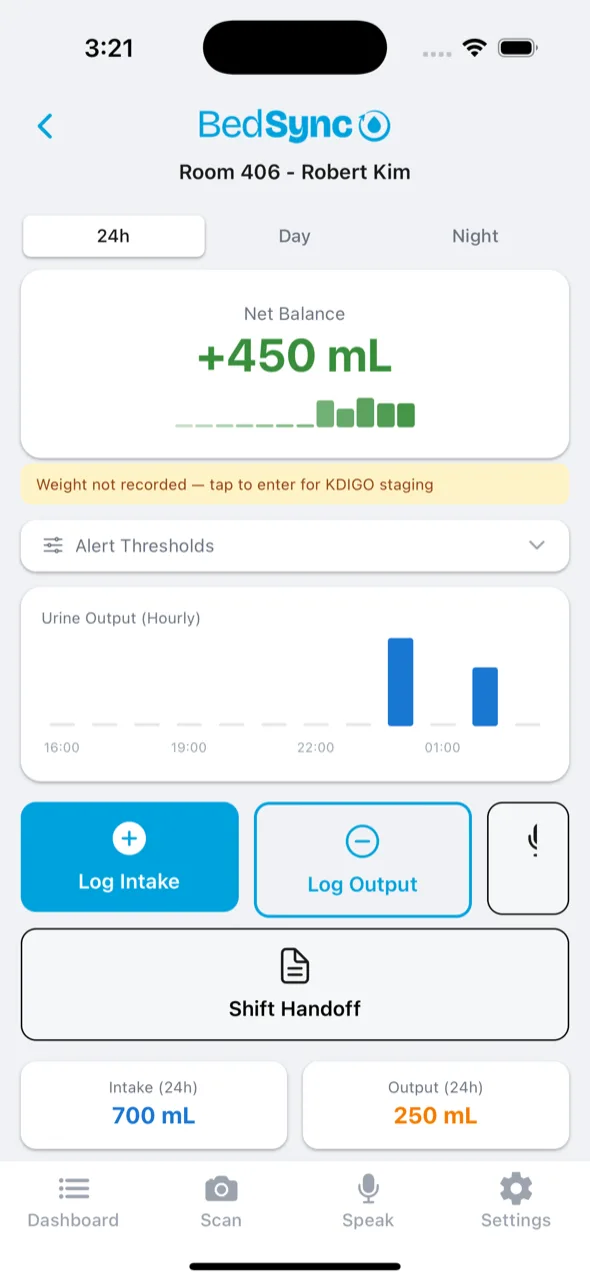
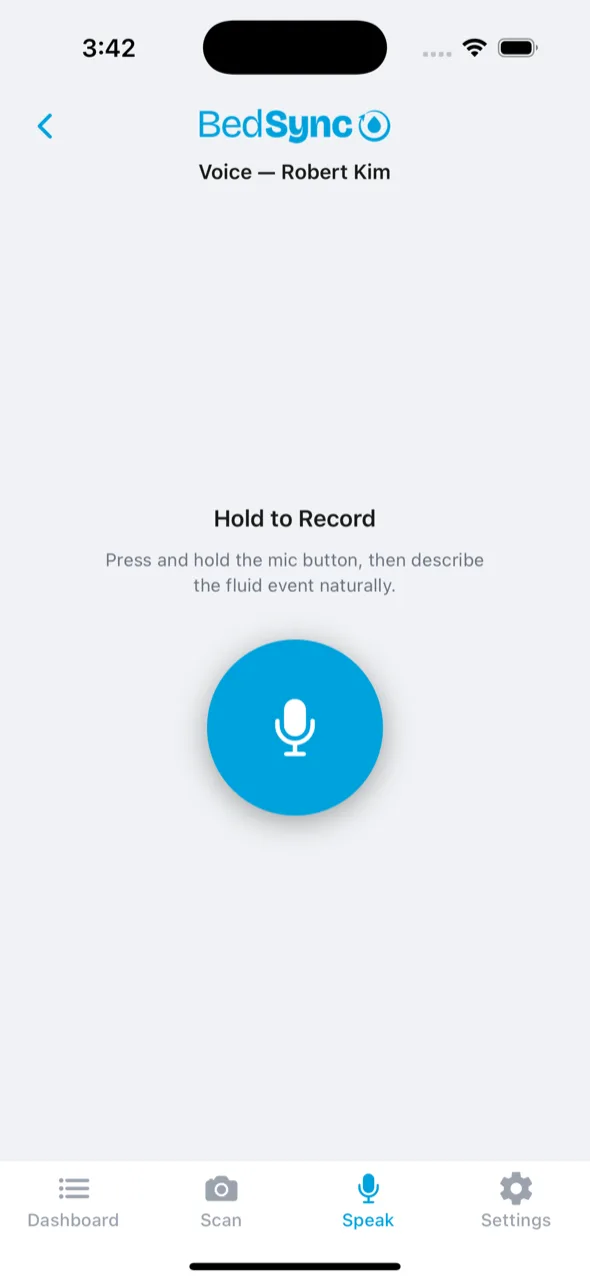
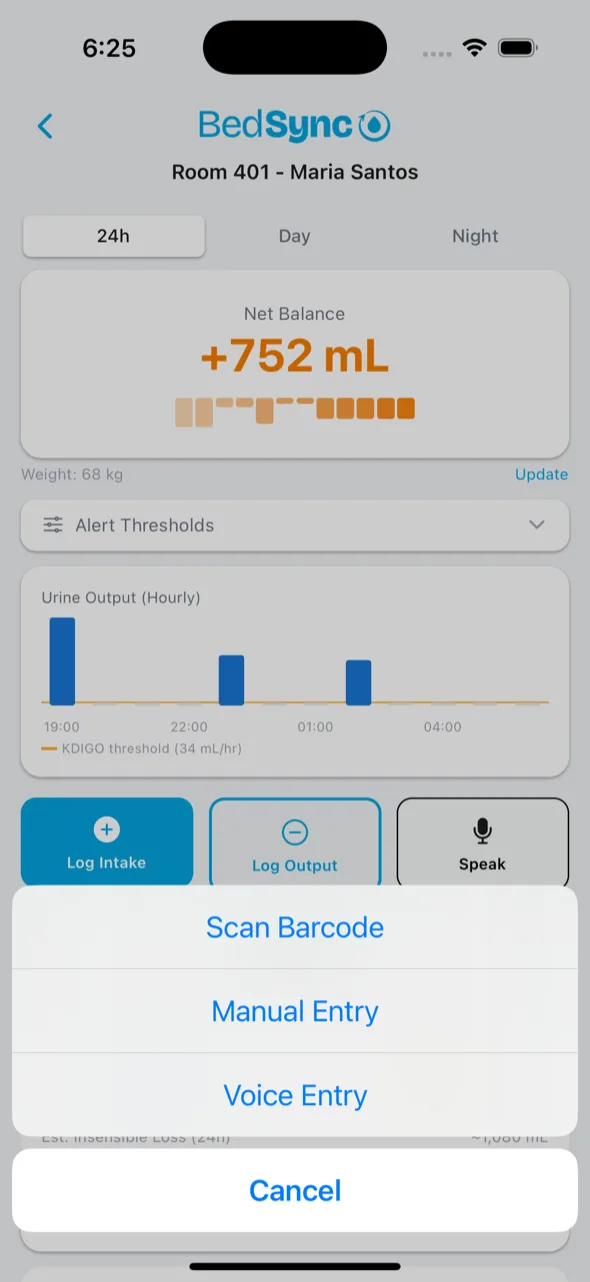
Voice-first fluid tracking.
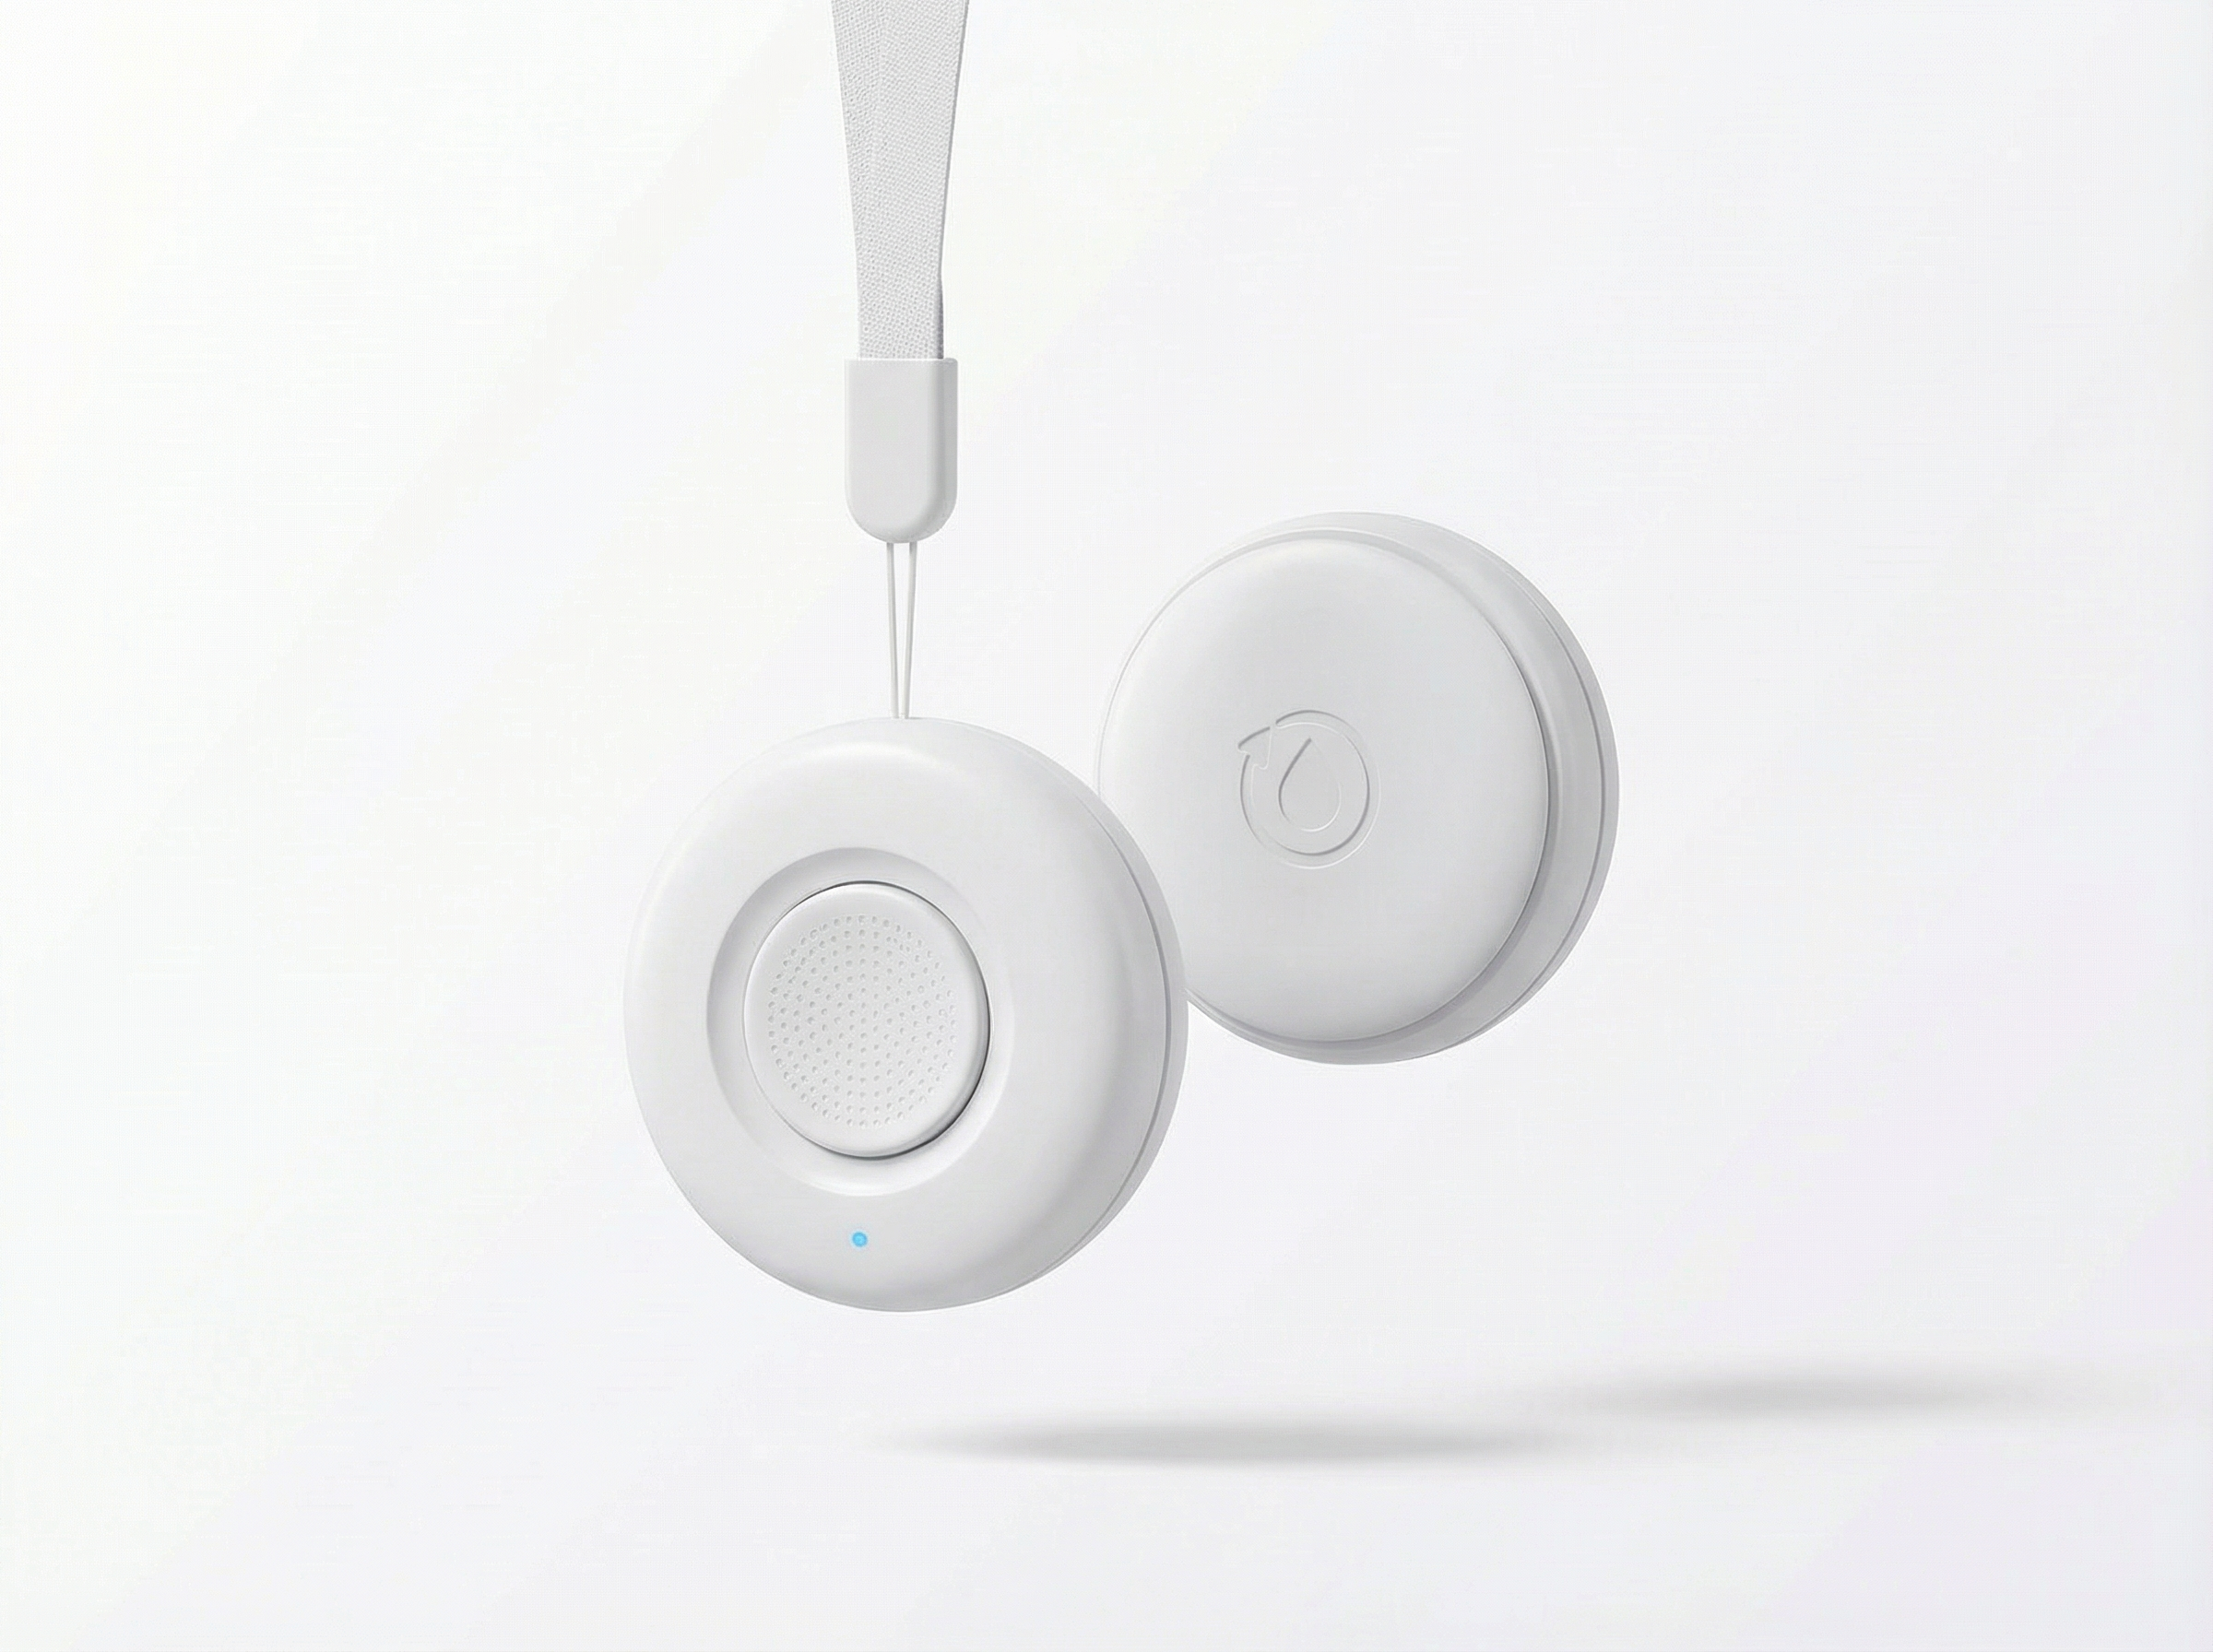
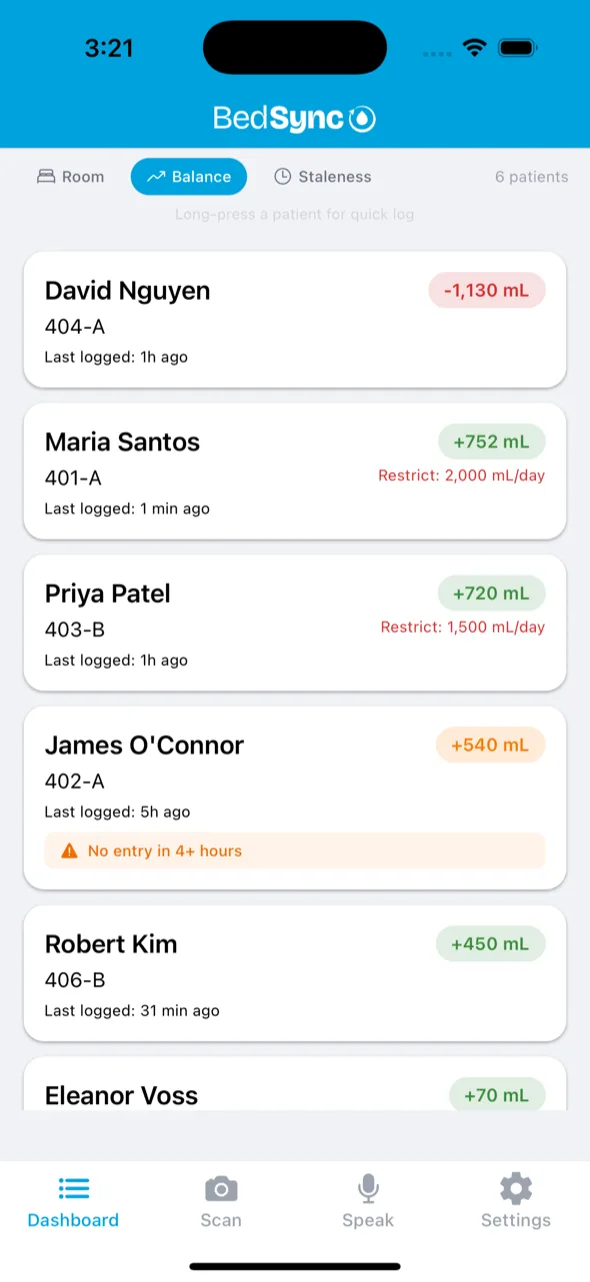
Phone or pod. Bedside to EHR.